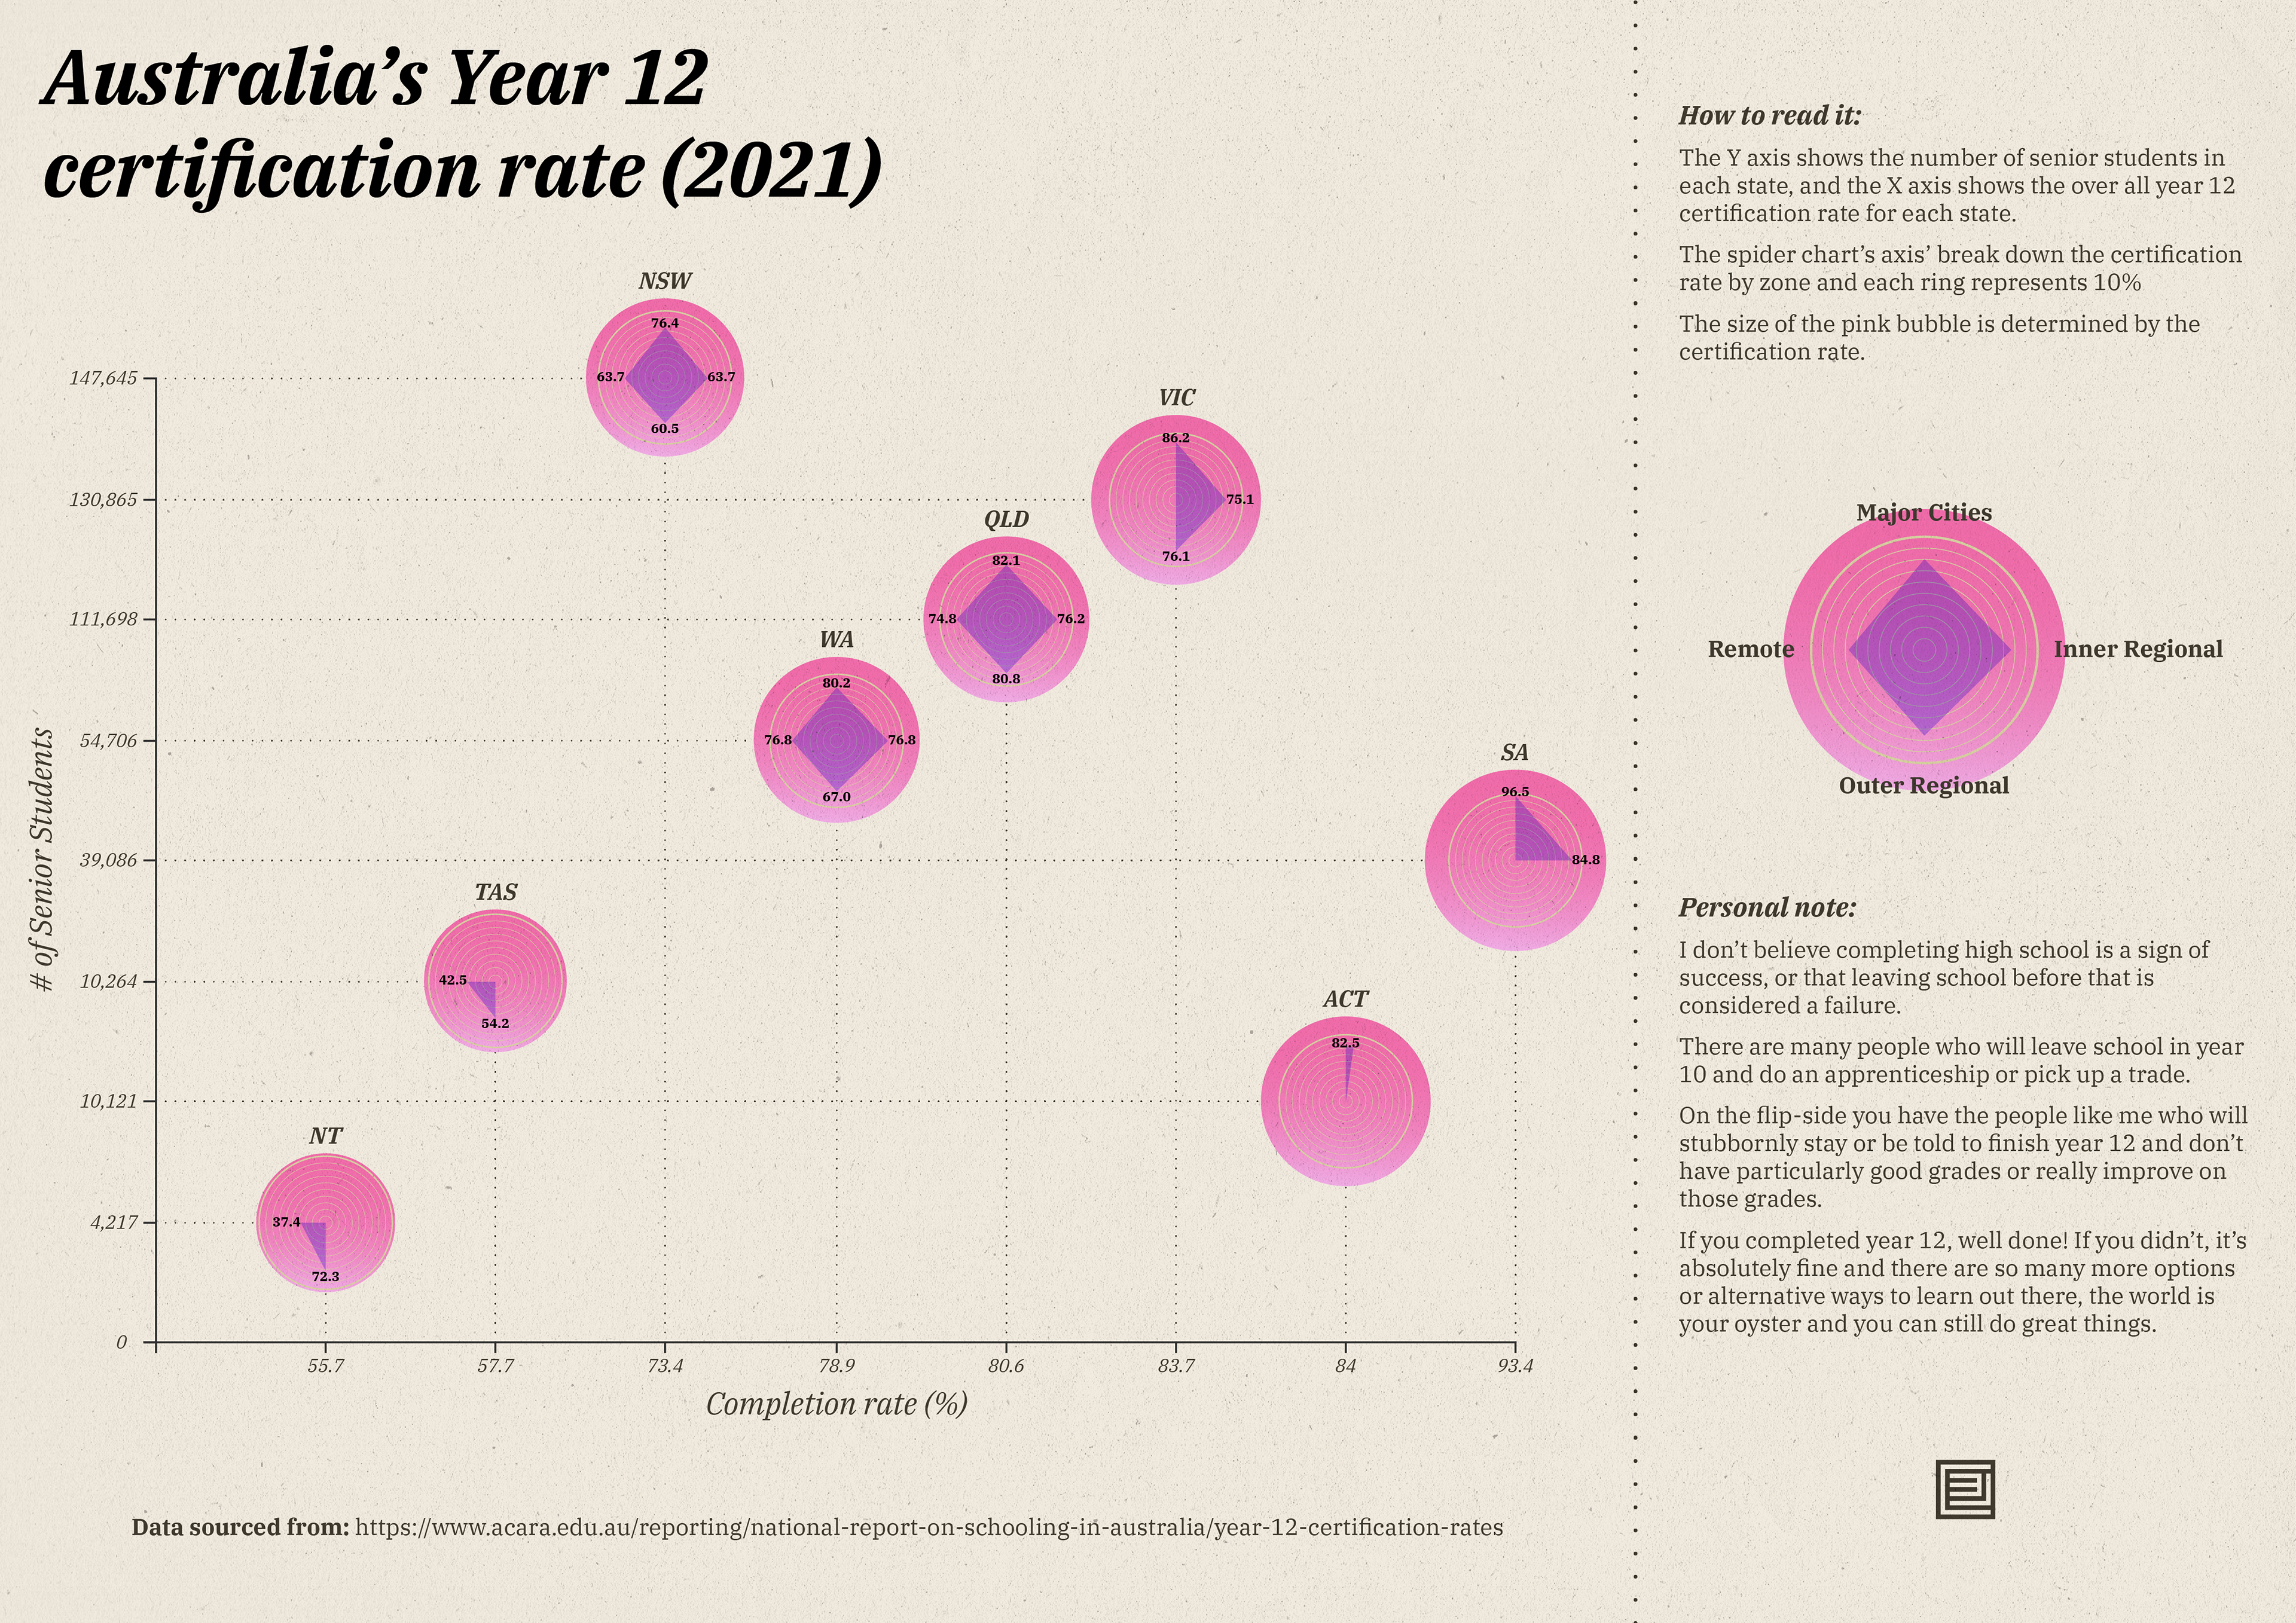
While working on a project for an employer I was given data on year 12 certification rates in Australia.
I used the data from this project to create this poster as a personal project while self-studying data visualisation.
Major Cities, Inner Regional, Outer Regional, and Remote are classified using ARIA+ (Accessibility/Remoteness Index of Australia plus). This ranks places by urban centre population. Then the distance from those depending on what category they fall into based on population (There were some jurisdiction caveats for TAS, NT, and ACT).
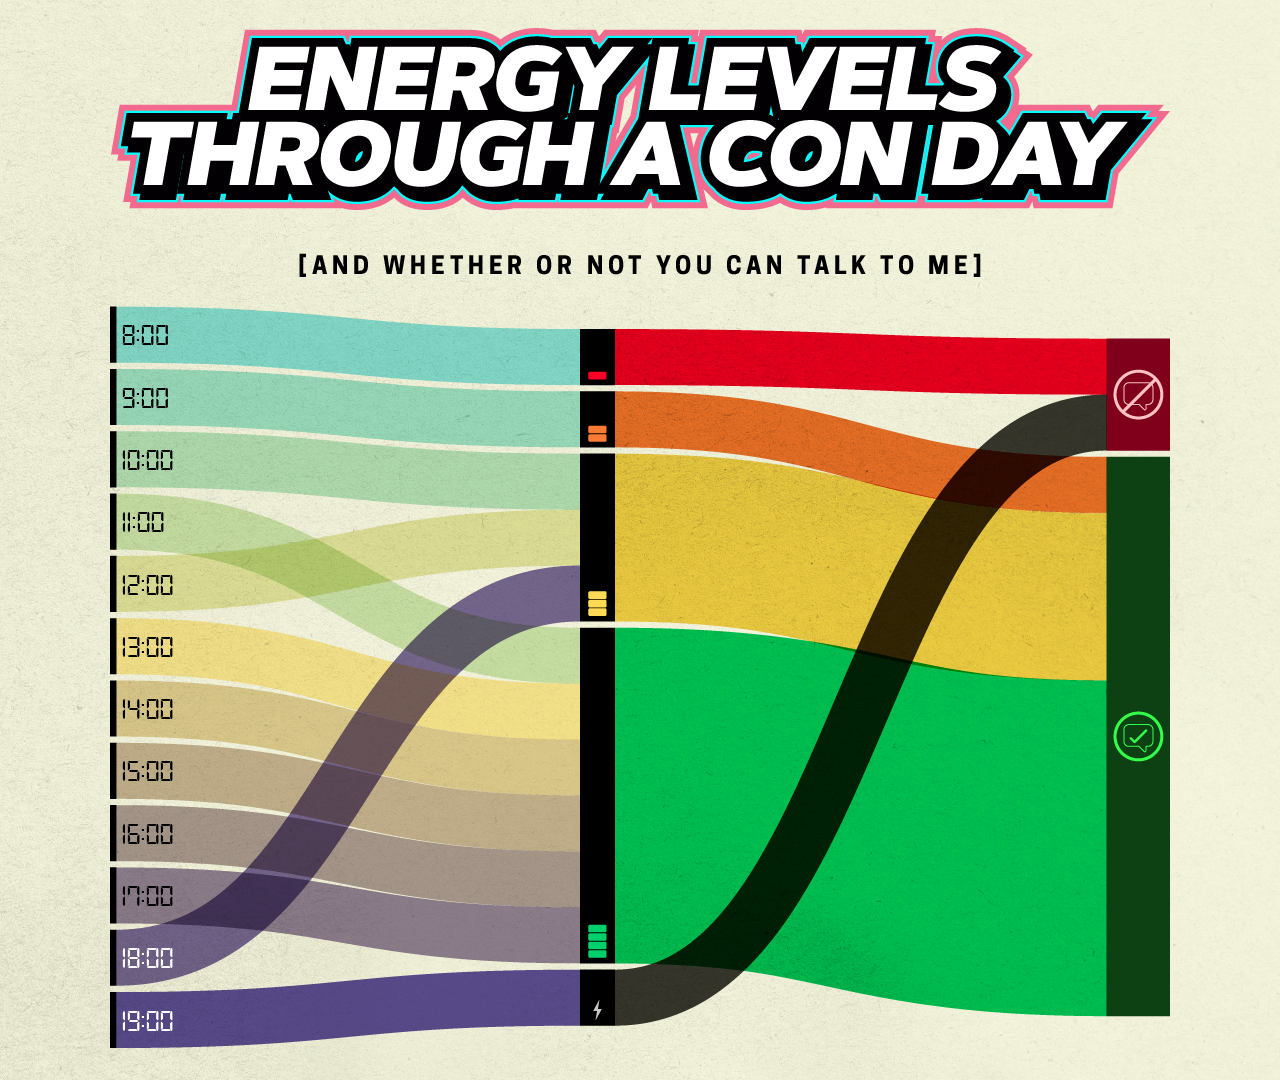
I designed this personal Alluvial chart as an experiment, combining colours and symbols with familiar concepts.
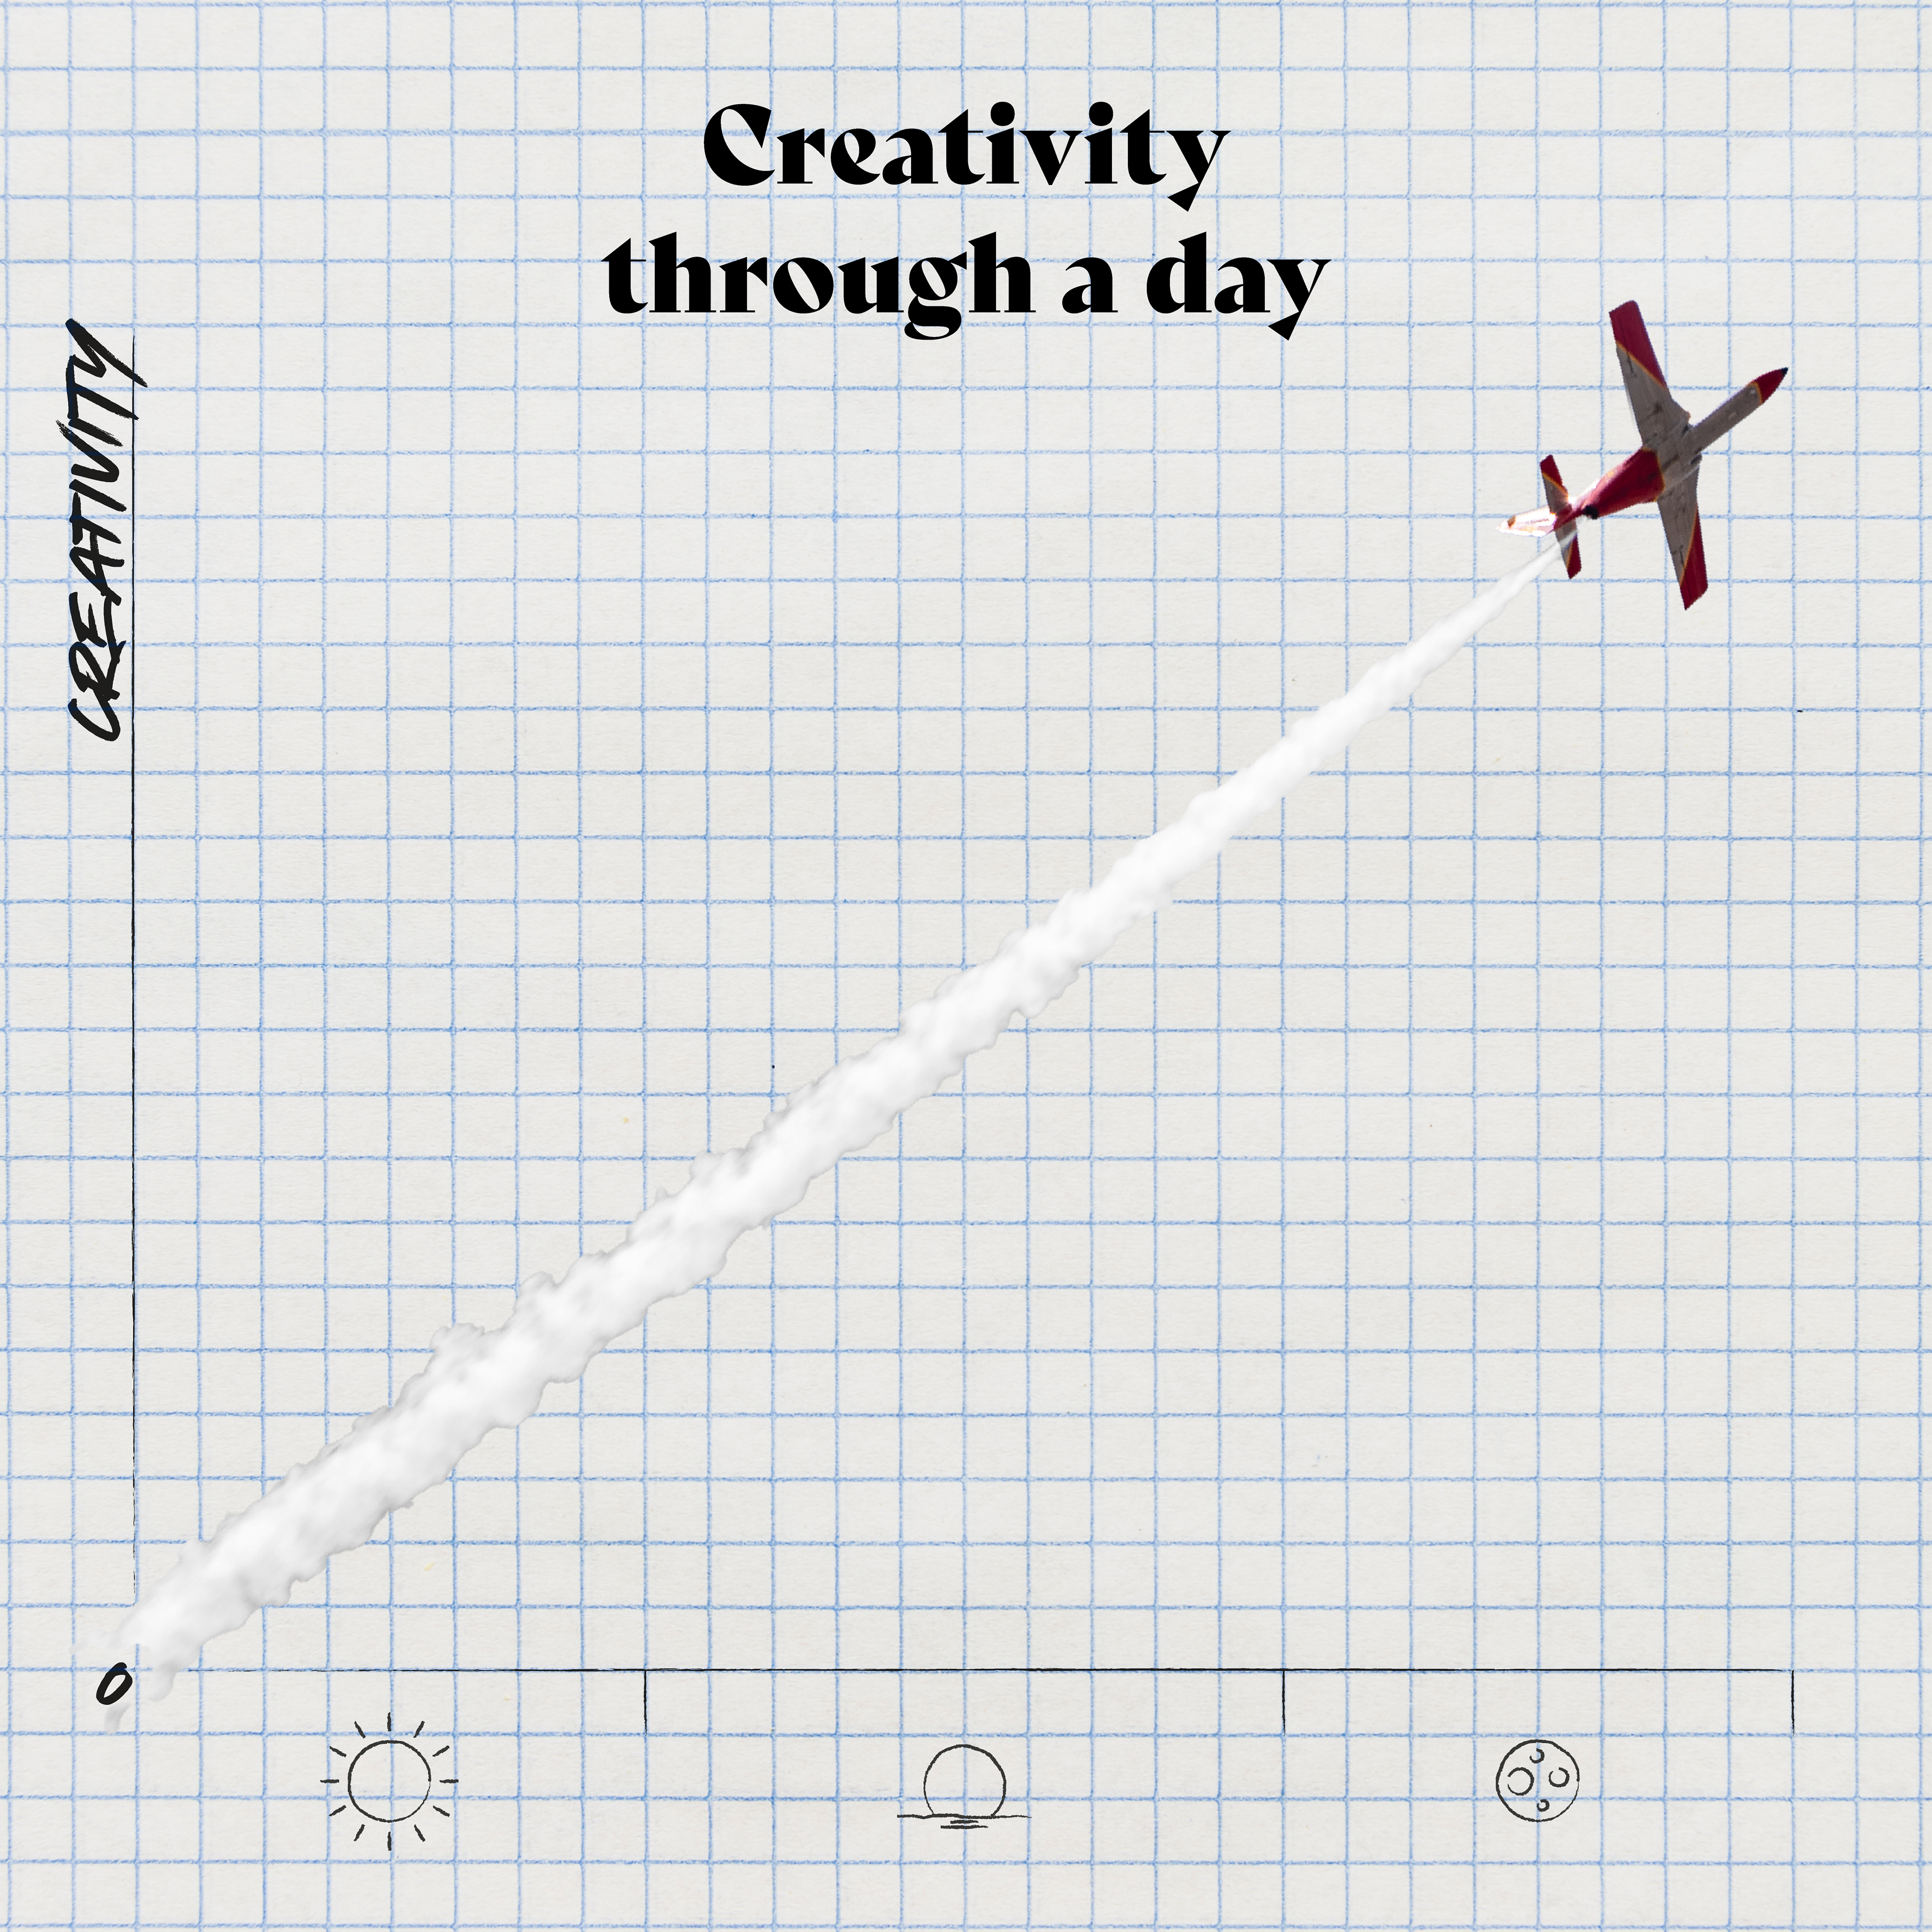
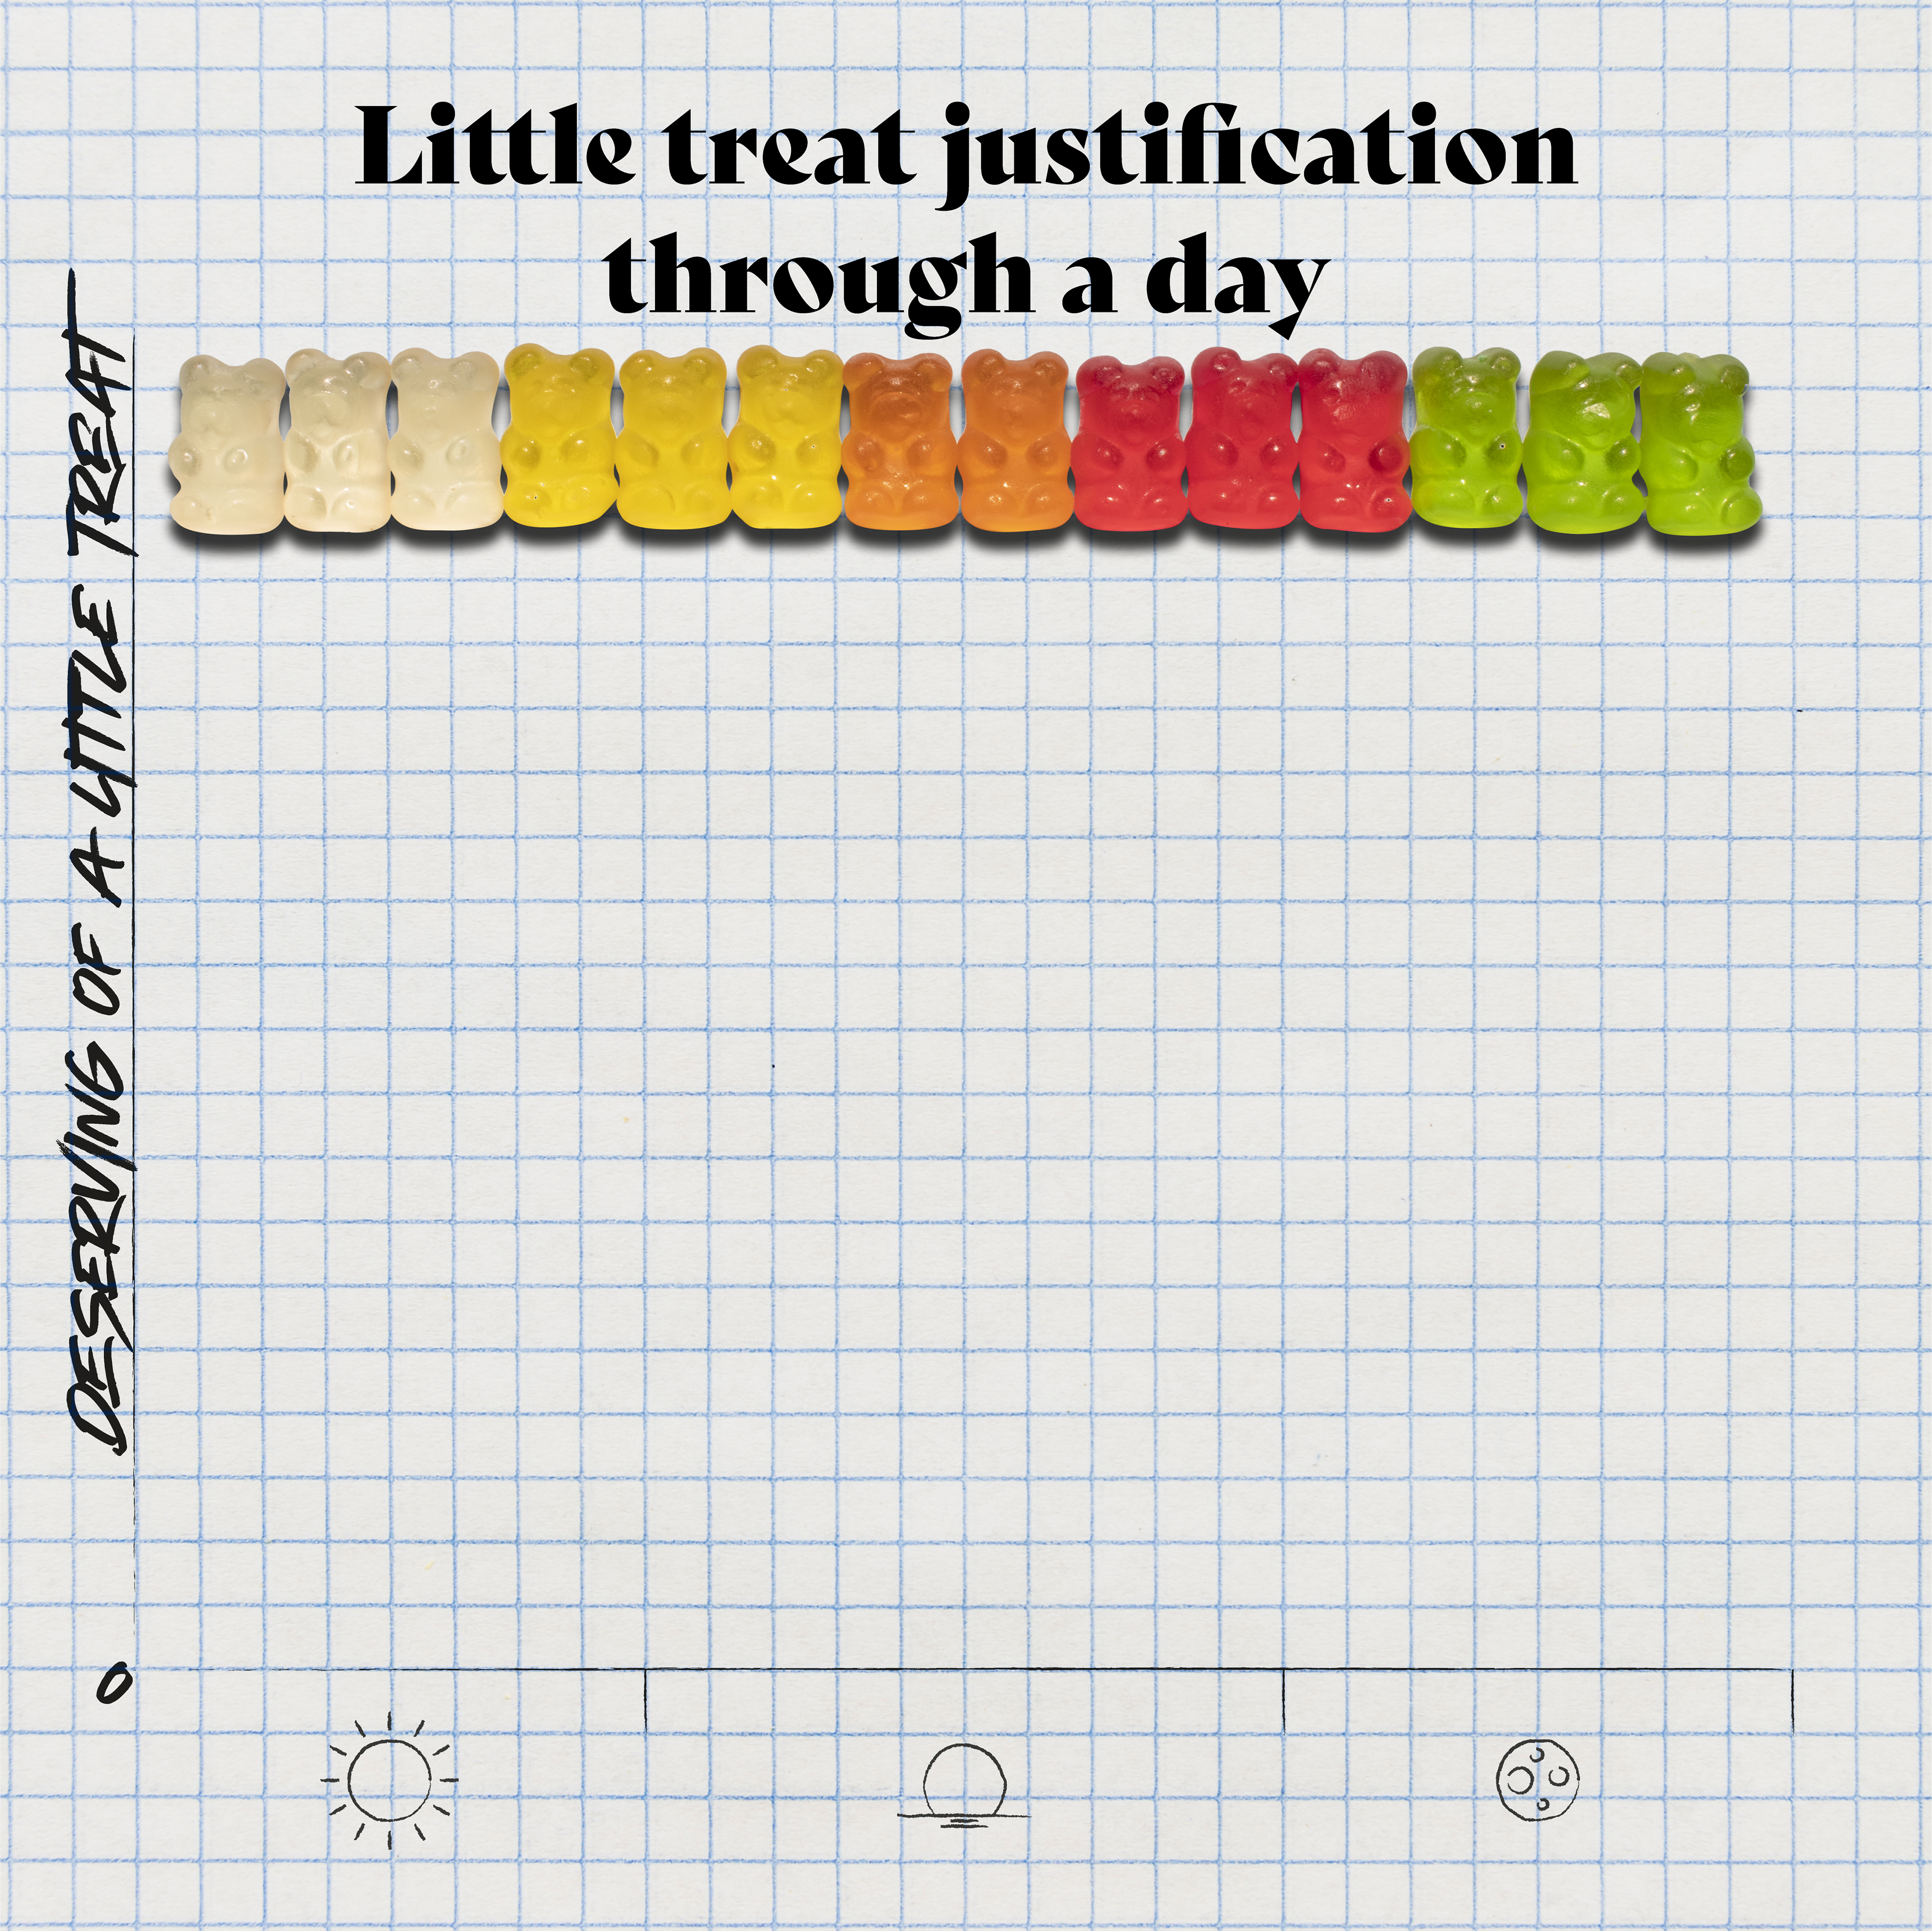
The intention here was to represent how I feel through a typical con day visually.
The intention here was to represent how I feel through a typical con day visually.
Another few personal infographics, this time trying to use certain photographic elements to illustrate the line.